2025年2月19日 星期三

Spark 新手筆記(一):在本機安裝 Spark 並執行一個簡單的 Scala 程式

最近開始參與 Spark 的專案,所以有空的時候會開始做一些 Spark 新手筆記 😆。我的環境是 Windows 11,不過實際上在不同環境的作法應該沒有差太多的感覺,但或許會有一些小地方有微妙的不同就是了。因為我自己的電腦是 Windows 11,但平常比較習慣在 Linux-based 的環境開發,所以實際上文章中會紀錄的東西,大體上會是 Windows 11 + WSL2 的狀況,指令原則上我都是在 WSL2 的 Ubuntu 裡執行的。

Spark 環境準備

首先,根據 Spark 官方文件來看,Spark 本身不需要安裝,只需要下載並執行相應的指令即可。因此主要需要準備的環境是 Java、Maven,並且下載 Spark。其中 Java 跟 Maven 怎麼安裝,我就直接略過了,這裡簡單說明我目前的環境:

  • Java: 21.0.6+7-Ubuntu-124.04.1
  • Maven: 3.8.8

在 Spark 官方網站下載 Spark 時,因為目前的最新版是 3.5.4,因此我是選擇以下的選項下載的:

  • Spark: 3.5.4
  • Package Type: Pre-built for Apache Hadoop 3.3 and later (Scala 2.13)

其中 Package Type 其實我目前也不太確定效果是什麼,但因為我的範例專案會用 Scala,因此就選了名字有 Scala 的 🙃。

準備範例專案

新手的第一件事就是先弄個 Hello World,不過 Spark 印 Hello World 好像有點弱,所以我弄了一個比 Hello World 複雜一滴滴的範例專案,順便也簡單試了一下 Spark 與 Scala 的寫法。

git clone git@github.com:jimwayneyeh/example-spark-scala.git

接著因為要把打包的 JAR 丟去給 Spark 執行,所以我們需要把這個專案打包成 JAR。

cd example-spark-scala
mvn clean package

打包出來的檔案會在 ./target/example-spark-scala-1.0-SNAPSHOT.jar,這個路徑先記住,等等會用到。在那之前先來看一下這個範例專案裡寫了什麼。首先可以先看 tw.jimwayneyeh.example.spark_scala.App 這個類別,它的內容如下:

object App {

  def main(args: Array[String]): Unit = {
    println("Hello World!")

    val spark = SparkSession.builder().appName("exmaple app").getOrCreate()
    val customerDf =
      spark.read.options(Map("header" -> "true")).csv("customers-100.csv")
    println(s"Count: ${customerDf.count()}")

    spark.stop()
  }

}

因為程式碼很短,就不一一贅述了,簡單來說就是先建立一個 SparkSession,讀取專案根目錄的 customers-100.csv 檔,這個 CSV 檔是從 sample-csv-files 下載的範例 CSV 檔。CSV 讀取進來變成 data frame,指定它是有標頭的,然後算出這個 data frame 的個數並印出來。

讀取檔案的部份要特別注意的是,這裡給的路徑是相對於專案目錄的路徑,但檔案並非放在 src/main/resources 資料夾內。我詢問 ChatGPT 時,ChatGPT 回答說 Spark 正常運作時,資料都是從外部路徑帶進來的,所以一般來說 Spark 程式並不會讀取 JAR 裡面的資源。這個理由聽起來是感覺蠻合理的,畢竟會特地用 Spark 執行的運算,資料量應該都不會小,也不會有人想把資料放進 JAR 裡吧 😆。

另外也看一下一個最簡單的 Spark 專案,如果用 Maven 打包的話,需要什麼東西。POM 裡面只需要以下的 dependencies 即可。

<dependency>
    <groupId>org.scala-lang</groupId>
    <artifactId>scala-library</artifactId>
    <version>${scala.version}</version>
</dependency>
<dependency> <!-- Spark dependency -->
    <groupId>org.apache.spark</groupId>
    <artifactId>spark-sql_${scala.binary.version}</artifactId>
    <version>3.5.4</version>
    <scope>provided</scope>
</dependency>

其中可以特別注意到,Spark 的 dependency 的 scope 會是 provided,這應該是因為實際執行時,JAR 會跑在 Spark 上,所以 Spark dependencies 應該在執行環境上都有。

在 Spark 執行

範例專案的 JAR 準備好以後,回到前面下載好的 Spark 壓縮檔,把它解壓縮後進入 /bin 資料夾,並且執行以下的 spark-submit 指令,就可以啟動一個本機的 Spark 環境執行剛剛的範例專案了。

./spark-submit --class "tw.jimwayneyeh.example.spark_scala.App" --master local /PATH/TO/PROJECT/target/example-spark-scala-1.0-SNAPSHOT.jar

等了一下之後,就可以看到 console 輸出的 Spark logs 了。這裡我貼了很長,是因為順便想要紀錄它的執行過程,之後想要分析它的內容。不過現階段重要的是 log 當中格式沒有日期的那兩行,因為程式碼是用 println() 來輸出的,所以會忽略 logging 格式直接在 console 印出只有 message 的 log。可以看出它算出了 data frame 裡面有 100 筆資料。

Hello World!
Count: 100

以下則是紀錄一下 log 當中印出跟 App.scala 有關的部份,這些 log 就是實際在排程並執行範例程式時的過程了。

25/02/19 00:38:51 INFO SparkContext: Created broadcast 0 from csv at App.scala:14
25/02/19 00:38:51 INFO FileSourceScanExec: Planning scan with bin packing, max size: 4211559 bytes, open cost is considered as scanning 4194304 bytes.
25/02/19 00:38:52 INFO SparkContext: Starting job: csv at App.scala:14
25/02/19 00:38:52 INFO DAGScheduler: Got job 0 (csv at App.scala:14) with 1 output partitions
25/02/19 00:38:52 INFO DAGScheduler: Final stage: ResultStage 0 (csv at App.scala:14)
25/02/19 00:38:52 INFO DAGScheduler: Parents of final stage: List()
25/02/19 00:38:52 INFO DAGScheduler: Missing parents: List()
25/02/19 00:38:52 INFO DAGScheduler: Submitting ResultStage 0 (MapPartitionsRDD[3] at csv at App.scala:14), which has no missing parents
25/02/19 00:38:52 INFO MemoryStore: Block broadcast_1 stored as values in memory (estimated size 13.8 KiB, free 434.2 MiB)
25/02/19 00:38:52 INFO MemoryStore: Block broadcast_1_piece0 stored as bytes in memory (estimated size 6.5 KiB, free 434.2 MiB)
25/02/19 00:38:52 INFO BlockManagerInfo: Added broadcast_1_piece0 in memory on 10.255.255.254:43927 (size: 6.5 KiB, free: 434.4 MiB)
25/02/19 00:38:52 INFO SparkContext: Created broadcast 1 from broadcast at DAGScheduler.scala:1585
25/02/19 00:38:52 INFO DAGScheduler: Submitting 1 missing tasks from ResultStage 0 (MapPartitionsRDD[3] at csv at App.scala:14) (first 15 tasks are for partitions Vector(0))
25/02/19 00:38:52 INFO TaskSchedulerImpl: Adding task set 0.0 with 1 tasks resource profile 0
25/02/19 00:38:52 INFO TaskSetManager: Starting task 0.0 in stage 0.0 (TID 0) (10.255.255.254, executor driver, partition 0, PROCESS_LOCAL, 9896 bytes) 
25/02/19 00:38:52 INFO Executor: Running task 0.0 in stage 0.0 (TID 0)
25/02/19 00:38:52 INFO CodeGenerator: Code generated in 12.528525 ms
25/02/19 00:38:52 INFO FileScanRDD: Reading File path: file:///mnt/g/scala/example-spark-scala/customers-100.csv, range: 0-17255, partition values: [empty row]
25/02/19 00:38:52 INFO CodeGenerator: Code generated in 40.709858 ms
25/02/19 00:38:53 INFO Executor: Finished task 0.0 in stage 0.0 (TID 0). 1800 bytes result sent to driver
25/02/19 00:38:53 INFO TaskSetManager: Finished task 0.0 in stage 0.0 (TID 0) in 697 ms on 10.255.255.254 (executor driver) (1/1)
25/02/19 00:38:53 INFO TaskSchedulerImpl: Removed TaskSet 0.0, whose tasks have all completed, from pool
25/02/19 00:38:53 INFO DAGScheduler: ResultStage 0 (csv at App.scala:14) finished in 0.890 s
25/02/19 00:38:53 INFO DAGScheduler: Job 0 is finished. Cancelling potential speculative or zombie tasks for this job
25/02/19 00:38:53 INFO TaskSchedulerImpl: Killing all running tasks in stage 0: Stage finished
25/02/19 00:38:53 INFO DAGScheduler: Job 0 finished: csv at App.scala:14, took 0.965247 s
25/02/19 00:38:53 INFO CodeGenerator: Code generated in 17.506485 ms
25/02/19 00:38:53 INFO FileSourceStrategy: Pushed Filters: 
25/02/19 00:38:53 INFO FileSourceStrategy: Post-Scan Filters:
25/02/19 00:38:53 INFO MemoryStore: Block broadcast_2 stored as values in memory (estimated size 199.5 KiB, free 434.0 MiB)
25/02/19 00:38:53 INFO MemoryStore: Block broadcast_2_piece0 stored as bytes in memory (estimated size 34.4 KiB, free 433.9 MiB)
25/02/19 00:38:53 INFO BlockManagerInfo: Added broadcast_2_piece0 in memory on 10.255.255.254:43927 (size: 34.4 KiB, free: 434.3 MiB)
25/02/19 00:38:53 INFO SparkContext: Created broadcast 2 from csv at App.scala:14
25/02/19 00:38:53 INFO FileSourceScanExec: Planning scan with bin packing, max size: 4211559 bytes, open cost is considered as scanning 4194304 bytes.
25/02/19 00:38:53 INFO FileSourceStrategy: Pushed Filters: 
25/02/19 00:38:53 INFO FileSourceStrategy: Post-Scan Filters:
25/02/19 00:38:53 INFO CodeGenerator: Code generated in 12.86595 ms
25/02/19 00:38:53 INFO MemoryStore: Block broadcast_3 stored as values in memory (estimated size 199.4 KiB, free 433.7 MiB)
25/02/19 00:38:53 INFO MemoryStore: Block broadcast_3_piece0 stored as bytes in memory (estimated size 34.4 KiB, free 433.7 MiB)
25/02/19 00:38:53 INFO BlockManagerInfo: Added broadcast_3_piece0 in memory on 10.255.255.254:43927 (size: 34.4 KiB, free: 434.3 MiB)
25/02/19 00:38:53 INFO SparkContext: Created broadcast 3 from count at App.scala:15
25/02/19 00:38:53 INFO FileSourceScanExec: Planning scan with bin packing, max size: 4211559 bytes, open cost is considered as scanning 4194304 bytes.
25/02/19 00:38:54 INFO DAGScheduler: Registering RDD 13 (count at App.scala:15) as input to shuffle 0
25/02/19 00:38:54 INFO DAGScheduler: Got map stage job 1 (count at App.scala:15) with 1 output partitions
25/02/19 00:38:54 INFO DAGScheduler: Final stage: ShuffleMapStage 1 (count at App.scala:15)
25/02/19 00:38:54 INFO DAGScheduler: Parents of final stage: List()
25/02/19 00:38:54 INFO DAGScheduler: Missing parents: List()
25/02/19 00:38:54 INFO DAGScheduler: Submitting ShuffleMapStage 1 (MapPartitionsRDD[13] at count at App.scala:15), which has no missing parents
25/02/19 00:38:54 INFO MemoryStore: Block broadcast_4 stored as values in memory (estimated size 18.8 KiB, free 433.7 MiB)
25/02/19 00:38:54 INFO MemoryStore: Block broadcast_4_piece0 stored as bytes in memory (estimated size 9.1 KiB, free 433.7 MiB)
25/02/19 00:38:54 INFO BlockManagerInfo: Added broadcast_4_piece0 in memory on 10.255.255.254:43927 (size: 9.1 KiB, free: 434.3 MiB)
25/02/19 00:38:54 INFO SparkContext: Created broadcast 4 from broadcast at DAGScheduler.scala:1585
25/02/19 00:38:54 INFO DAGScheduler: Submitting 1 missing tasks from ShuffleMapStage 1 (MapPartitionsRDD[13] at count at App.scala:15) (first 15 tasks are for partitions Vector(0))
25/02/19 00:38:54 INFO TaskSchedulerImpl: Adding task set 1.0 with 1 tasks resource profile 0
25/02/19 00:38:54 INFO TaskSetManager: Starting task 0.0 in stage 1.0 (TID 1) (10.255.255.254, executor driver, partition 0, PROCESS_LOCAL, 9885 bytes)
25/02/19 00:38:54 INFO Executor: Running task 0.0 in stage 1.0 (TID 1)
25/02/19 00:38:54 INFO CodeGenerator: Code generated in 11.085534 ms
25/02/19 00:38:54 INFO FileScanRDD: Reading File path: file:///mnt/g/scala/example-spark-scala/customers-100.csv, range: 0-17255, partition values: [empty row]
25/02/19 00:38:54 INFO CodeGenerator: Code generated in 7.906767 ms
25/02/19 00:38:54 INFO Executor: Finished task 0.0 in stage 1.0 (TID 1). 2105 bytes result sent to driver
25/02/19 00:38:54 INFO TaskSetManager: Finished task 0.0 in stage 1.0 (TID 1) in 320 ms on 10.255.255.254 (executor driver) (1/1)
25/02/19 00:38:54 INFO TaskSchedulerImpl: Removed TaskSet 1.0, whose tasks have all completed, from pool
25/02/19 00:38:54 INFO DAGScheduler: ShuffleMapStage 1 (count at App.scala:15) finished in 0.351 s
25/02/19 00:38:54 INFO DAGScheduler: looking for newly runnable stages
25/02/19 00:38:54 INFO DAGScheduler: running: HashSet()
25/02/19 00:38:54 INFO DAGScheduler: waiting: HashSet()
25/02/19 00:38:54 INFO DAGScheduler: failed: HashSet()
25/02/19 00:38:54 INFO BlockManagerInfo: Removed broadcast_2_piece0 on 10.255.255.254:43927 in memory (size: 34.4 KiB, free: 434.3 MiB)
25/02/19 00:38:54 INFO BlockManagerInfo: Removed broadcast_1_piece0 on 10.255.255.254:43927 in memory (size: 6.5 KiB, free: 434.3 MiB)
25/02/19 00:38:54 INFO BlockManagerInfo: Removed broadcast_0_piece0 on 10.255.255.254:43927 in memory (size: 34.4 KiB, free: 434.4 MiB)
25/02/19 00:38:54 INFO CodeGenerator: Code generated in 12.077153 ms
25/02/19 00:38:54 INFO SparkContext: Starting job: count at App.scala:15
25/02/19 00:38:54 INFO DAGScheduler: Got job 2 (count at App.scala:15) with 1 output partitions
25/02/19 00:38:54 INFO DAGScheduler: Final stage: ResultStage 3 (count at App.scala:15)
25/02/19 00:38:54 INFO DAGScheduler: Parents of final stage: List(ShuffleMapStage 2)
25/02/19 00:38:54 INFO DAGScheduler: Missing parents: List()
25/02/19 00:38:54 INFO DAGScheduler: Submitting ResultStage 3 (MapPartitionsRDD[16] at count at App.scala:15), which has no missing parents
25/02/19 00:38:54 INFO MemoryStore: Block broadcast_5 stored as values in memory (estimated size 13.1 KiB, free 434.1 MiB)
25/02/19 00:38:54 INFO MemoryStore: Block broadcast_5_piece0 stored as bytes in memory (estimated size 6.1 KiB, free 434.1 MiB)
25/02/19 00:38:54 INFO BlockManagerInfo: Added broadcast_5_piece0 in memory on 10.255.255.254:43927 (size: 6.1 KiB, free: 434.4 MiB)
25/02/19 00:38:54 INFO SparkContext: Created broadcast 5 from broadcast at DAGScheduler.scala:1585
25/02/19 00:38:54 INFO DAGScheduler: Submitting 1 missing tasks from ResultStage 3 (MapPartitionsRDD[16] at count at App.scala:15) (first 15 tasks are for partitions Vector(0))
25/02/19 00:38:54 INFO TaskSchedulerImpl: Adding task set 3.0 with 1 tasks resource profile 0
25/02/19 00:38:54 INFO TaskSetManager: Starting task 0.0 in stage 3.0 (TID 2) (10.255.255.254, executor driver, partition 0, NODE_LOCAL, 9276 bytes)
25/02/19 00:38:54 INFO Executor: Running task 0.0 in stage 3.0 (TID 2)
25/02/19 00:38:54 INFO ShuffleBlockFetcherIterator: Getting 1 (60.0 B) non-empty blocks including 1 (60.0 B) local and 0 (0.0 B) host-local and 0 (0.0 B) push-merged-local and 0 (0.0 B) remote blocks
25/02/19 00:38:54 INFO ShuffleBlockFetcherIterator: Started 0 remote fetches in 15 ms
25/02/19 00:38:54 INFO CodeGenerator: Code generated in 8.620798 ms
25/02/19 00:38:54 INFO Executor: Finished task 0.0 in stage 3.0 (TID 2). 4084 bytes result sent to driver
25/02/19 00:38:54 INFO TaskSetManager: Finished task 0.0 in stage 3.0 (TID 2) in 97 ms on 10.255.255.254 (executor driver) (1/1)
25/02/19 00:38:54 INFO TaskSchedulerImpl: Removed TaskSet 3.0, whose tasks have all completed, from pool
25/02/19 00:38:54 INFO DAGScheduler: ResultStage 3 (count at App.scala:15) finished in 0.108 s
25/02/19 00:38:54 INFO DAGScheduler: Job 2 is finished. Cancelling potential speculative or zombie tasks for this job
25/02/19 00:38:54 INFO TaskSchedulerImpl: Killing all running tasks in stage 3: Stage finished
25/02/19 00:38:54 INFO DAGScheduler: Job 2 finished: count at App.scala:15, took 0.120309 s
Count: 100
25/02/19 00:38:54 INFO SparkContext: SparkContext is stopping with exitCode 0.
​

2025年2月5日 星期三

在 Windows 11 使用 Ollama 執行 Chat AI

在本機想要執行大型語言模型,目前常見的方法就是透過 Ollama。所以這篇稍微紀錄一下需要做哪些事。不過其實要做的很少,跟之前裝 Stable Diffusion 比起來,Ollama 非常容易 😆

  1. 首先,先去 Ollama 官網下載 Ollama 安裝,這個步驟就跟一般裝 Windows 應用程式一樣,有安裝介面,所以沒什麼特殊的動作。
  2. 如果有 nVIdia 顯卡,建議裝一下 CUDA Toolkit。
  3. 打開 PowerShell,輸入 ollama -h,會列出 Ollama 可以用的指令。
> ollama -h
Large language model runner

Usage:
  ollama [flags]
  ollama [command]

Available Commands:
  serve       Start ollama
  create      Create a model from a Modelfile
  show        Show information for a model
  run         Run a model
  stop        Stop a running model
  pull        Pull a model from a registry
  push        Push a model to a registry
  list        List models
  ps          List running models
  cp          Copy a model
  rm          Remove a model
  help        Help about any command

Flags:
  -h, --help      help for ollama
  -v, --version   Show version information

Use "ollama [command] --help" for more information about a command.
  1. 在進入下一步開始正式執行之前,建議可以考慮在環境變數設定 OLLAMA_MODELS。這是因為 Ollama 預設會在使用者目錄下的 /.ollama 資料夾中放下載的 model,有些比較大的 model 甚至有幾百 GB 的,因此建議透過設定 OLLAMA_MODELS 環境變數,讓 Ollama 把 model 下載到其他非 C: 的路徑。注意設了環境變數以後,要把 Ollama 完全關閉再重啟才會生效。
  2. 然後就可以實驗了,先拿 Llama 3.2 試試。輸入 ollama run llama3.2 就可以自動下載 Llama 3.2 的 model 並執行。
> ollama run llama3.2
pulling manifest
pulling dde5aa3fc5ff... 100% ▕███████████████████████████████████████████████████████████████▏ 2.0 GB
pulling 966de95ca8a6... 100% ▕███████████████████████████████████████████████████████████████▏ 1.4 KB
pulling fcc5a6bec9da... 100% ▕███████████████████████████████████████████████████████████████▏ 7.7 KB
pulling a70ff7e570d9... 100% ▕███████████████████████████████████████████████████████████████▏ 6.0 KB
pulling 56bb8bd477a5... 100% ▕███████████████████████████████████████████████████████████████▏   96 B
pulling 34bb5ab01051... 100% ▕███████████████████████████████████████████████████████████████▏  561 B
verifying sha256 digest
writing manifest
success
>>>

接著就可以開始跟 Llama 對話了。之後大概就只剩要用哪個 model 之類的而已,可以參考 Ollama 的 models 頁面,看看有哪些 model 以及哪些大小可以選。

​

2024年12月25日 星期三

[筆記] Fluentd log driver 的 fluent-buffer-limit 定義

在過去,fluent-buffer-limit 的定義是用 byte 來指定的,但在 docker 19.0.3 以後,同樣的參數,定義變成 log 行數了。所以這有可能導致 docker log driver 使用了遠比預期還多的記憶體。

https://github.com/moby/moby/issues/41488

2024年11月26日 星期二

[筆記] Apache HTTP Client 5 的注意事項

  • 要控制 timeout,應該使用的是 RequestConfig 裡的 connectTimeout,而不是 responseTimeout。
  • responseTimeout 從原始碼來看,跟 socketTimeout 是差不多的東西。
  • socketTimeout 代表的意思是距離上一次 network I/O 的時間差。也就是說,如果設定 socketTimeout 為 nms,則每 n-1 ms 收到一個封包,也是不會觸發 timeout 的。
​

2024年7月12日 星期五

[筆記] AWS ECS 問題排查筆記

快速筆記,最近花了非常多時間在研究為什麼 ECS 底下的 EC2 作業系統從 CentOS 7 升級成 Amazon Linux 2023 後,上頭的 ECS container 出現一堆問題。

主要遇到的問題似乎是 I/O 的緣故。EBS I/O 超過部署時設定的 throughput 的話,會導致 EC2 變得很不穩定,例如無法 SSH 進入 EC2、或者 EC2 上的 ECS agent 會斷線等等。這個問題可能會衍生出 EC2 上的 ECS container 無法正常寫檔案,要寫入檔案的內容可能會一直被 cache 在 dirty page 上,導致 container 的記憶體用量超出預期。

至於為什麼 EBS I/O 的用量會超出部署的設定,這點暫時還沒有結論,不過 architect 有發現 Amazon Linux 2023 寫 system journal 寫蠻多的,相較來說,CentOS 幾乎不寫 system journal。

2024年6月15日 星期六

Spring Cache + AspectJ 背後的大致流程

因為最近在專案中整合 Spring Cache,不過原生的 Spring Cache 支援的功能有點基本,我們想要擴充它的功能,所以需要稍微了解一下 Spring Cache 背後到底怎麼運作的,我們才有辦法找出比較合適的擴充方式。

網路上可以找到一些中國網友的原始碼解析,不過大多數找到的都是用預設的 Spring AOP,但我們專案的狀況會使用 AspectJ,所以這邊會紀錄 AspectJ 的狀況是如何運作的。

另外,因為我們還在用 Spring Boot 2.7,所以這裡會先關注在 Spring v5.3.31 版的原始碼。相關的 Spring Cache 官方文件可以參考這裡。

Spring Cache 的使用方式

那麼要從哪裡開始追蹤呢?先來看一下 Spring Cache 怎麼使用的。

@Configuration
@EnableCaching
public class AppConfig {
}

@Cacheable("books")
public Book findBook(ISBN isbn) {...}

Spring Cache 最基本的使用方式,就是像上面的例子那樣,用 @Cacheable 註解來告訴 Spring 說 findBook(...) 這個 method 要被 cache,並且需要提供一個 configuration,上面有 @EnableCaching 來要求要啟用 cache。這裡其實還需要一點其他的設定,不過因為不是這裡的重點,所以我都先略過 😆。總之,起點就是 @EnableCaching 了。

Cache 的載入流程

載入 Configuration

首先從 @EnableCaching 這個註解開始看,它的內容大概是這樣:

@Target(ElementType.TYPE)
@Retention(RetentionPolicy.RUNTIME)
@Documented
@Import(CachingConfigurationSelector.class)
public @interface EnableCaching {
}

可以注意到,它宣告了 @Import,因此 Spring 會使用它指定的 CachingConfigurationSelector 來得知到載入什麼東西。

CachingConfigurationSelector (git) 是一個透過 parent 實作了 ImportSelector 的類別,因此它主要提供 selectImports 這個方法,用來告訴 Spring 說要載入的 class 的 FQDN 是什麼。比較重要的內容如下:

public class CachingConfigurationSelector extends AdviceModeImportSelector<EnableCaching> {
  ...
  private static final String CACHE_ASPECT_CONFIGURATION_CLASS_NAME =
            "org.springframework.cache.aspectj.AspectJCachingConfiguration";
  ...

  @Override
  public String[] selectImports(AdviceMode adviceMode) {
    switch (adviceMode) {
      case PROXY:
        return getProxyImports();
      case ASPECTJ:
        return getAspectJImports();
      default:
        return null;
    }
  }

  ...
  private String[] getAspectJImports() {
    List<String> result = new ArrayList<>(2);
    result.add(CACHE_ASPECT_CONFIGURATION_CLASS_NAME);
    if (jsr107Present && jcacheImplPresent) {
      result.add(JCACHE_ASPECT_CONFIGURATION_CLASS_NAME);
    }
    return StringUtils.toStringArray(result);
    }

在 selectImports() 中,會依據註解設定的 adviceMode 決定 import 時要給哪個 class name,因為前面提到我們要用的是 AspectJ,並且我們並沒有要用 JSR-107,所以這裡就只看純 AspectJ 的狀況。所以可以看出,這裡如果 adviseMode 設定為 AspectJ 的話,它會回覆的 FQDN 是 org.springframework.cache.aspectj.AspectJCachingConfiguration。

於是接著來看一下 AspectJ 的 Configuration (git) 寫了什麼~。

@Configuration(proxyBeanMethods = false)
@Role(BeanDefinition.ROLE_INFRASTRUCTURE)
public class AspectJCachingConfiguration extends AbstractCachingConfiguration {

  @Bean(name = CacheManagementConfigUtils.CACHE_ASPECT_BEAN_NAME)
  @Role(BeanDefinition.ROLE_INFRASTRUCTURE)
  public AnnotationCacheAspect cacheAspect() {
    AnnotationCacheAspect cacheAspect = AnnotationCacheAspect.aspectOf();
    cacheAspect.configure(this.errorHandler, this.keyGenerator, this.cacheResolver, this.cacheManager);
    return cacheAspect;
  }

}

這裡最主要就是提供一個 Bean,這個 Bean 是用來建立 AnnotationCacheAspect 的,並且在建立的同時會把註解上的設定、以及其他需要建立的例如 ErrorHandler、KeyGenerator、CacheResolver、CacheManager 等東西都一起注入進去。

所以到這裡稍微總結一下,這整段代表的意思,是當 Spring 讀到 @EnableCaching 註解時,會基於這個 Selector 決定去載入指定的 Configuration,然後就會依據 Configuration 的內容去建立包含 CacheManager 等等的 Bean,並且初始化一個 Aspect,把那些 Aspect 需要用到的 Bean 注入到 Aspect 當中。

Aspect 被初始化以後,後面的主要工作應該就是 AspectJ 的範疇了。不過因為我目前還沒有很完整地看過 AspectJ 的文件,所以只有大略知道一些資訊,如果紀錄有誤歡迎提醒 😆。

AspectJ 在縫合的時候,會讓 Aspect 擁有 aspectOf() 的 method (doc),所以 Spring 才有辦法呼叫 aspectOf() 來取得這個 Aspect,並且對它做設定。

載入並註冊 Aspect

前段被建立的 AnnotationCacheAspect (git) 是一個 .aj 檔,所以內容基本上就是 AspectJ 的定義了:

public aspect AnnotationCacheAspect extends AbstractCacheAspect {

  public AnnotationCacheAspect() {
    super(new AnnotationCacheOperationSource(false));
  }

  /**
   * Matches the execution of any public method in a type with the @{@link Cacheable}
   * annotation, or any subtype of a type with the {@code @Cacheable} annotation.
   */
  private pointcut executionOfAnyPublicMethodInAtCacheableType() :
      execution(public * ((@Cacheable *)+).*(..)) && within(@Cacheable *);

  ...

  /**
   * Definition of pointcut from super aspect - matched join points will have Spring
   * cache management applied.
   */
  protected pointcut cacheMethodExecution(Object cachedObject) :
    (executionOfAnyPublicMethodInAtCacheableType()
        || executionOfAnyPublicMethodInAtCacheEvictType()
        || executionOfAnyPublicMethodInAtCachePutType()
        || executionOfAnyPublicMethodInAtCachingType()
        || executionOfCacheableMethod()
        || executionOfCacheEvictMethod()
        || executionOfCachePutMethod()
        || executionOfCachingMethod())
      && this(cachedObject);

這裡我把其他部份都略過了,只先看它定義關於 @Cacheable 的部份。它定義了一個 pointcut 叫做 executionOfAnyPublicMethodInAtCacheableType(),會被橫切到所有有標註 @Cacheable 的 public method 上。那麼 pointcut 要執行的邏輯是什麼呢?這就需要看它的 parent AbstractCacheAspect (git) 了。

public abstract aspect AbstractCacheAspect extends CacheAspectSupport implements DisposableBean {
  ...
  @SuppressAjWarnings("adviceDidNotMatch")
  Object around(final Object cachedObject) : cacheMethodExecution(cachedObject) {
    MethodSignature methodSignature = (MethodSignature) thisJoinPoint.getSignature();
    Method method = methodSignature.getMethod();

    CacheOperationInvoker aspectJInvoker = new CacheOperationInvoker() {
        public Object invoke() {
          try {
            return proceed(cachedObject);
          }
          catch (Throwable ex) {
            throw new ThrowableWrapper(ex);
          }
        }
    };

    try {
      return execute(aspectJInvoker, thisJoinPoint.getTarget(), method, thisJoinPoint.getArgs());
    }
    catch (CacheOperationInvoker.ThrowableWrapper th) {
      AnyThrow.throwUnchecked(th.getOriginal());
      return null; // never reached
    }
  }
}

可以看出,它定義了一個 around 並綁定在 cacheMethodExecution() 上,而 cacheMethodExecution() 這個 pointcut 則是定義一系列的 pointcuts。所以我的理解是,它應該是把 around 綁到所有它列出來的 pointcut,也就是像是 @Cacheable、`CachePut 等等的 pointcut。

接著來看這個 around 裡面的內容。它首先先建立了一個 CacheOperationInvoker 的 instance,這個 invoker 的目的是用來呼叫被 cache 的 method 的,接著就去呼叫 execute(),把 JoinPoint 的資訊以及剛剛建立的 invoker 都傳進去。

execute() 是 AbstractCacheAspect 從它的 parent CacheAspectSupport 繼承來的,所以接著就再去看 CacheAspectSupport 裡的內容。不過裡面內容蠻多的,所以只先節錄了 execute() 的部份:

@Nullable
protected Object execute(CacheOperationInvoker invoker, Object target, Method method, Object[] args) {
  // Check whether aspect is enabled (to cope with cases where the AJ is pulled in automatically)
  if (this.initialized) {
    Class<?> targetClass = getTargetClass(target);
    CacheOperationSource cacheOperationSource = getCacheOperationSource();
    if (cacheOperationSource != null) {
      Collection<CacheOperation> operations = cacheOperationSource.getCacheOperations(method, targetClass);
      if (!CollectionUtils.isEmpty(operations)) {
        return execute(invoker, method,
            new CacheOperationContexts(operations, method, args, target, targetClass));
      }
    }
  }

  return invoker.invoke();
}

這段最主要的行為,是在檢查自己初始化的狀態,如果初始化還沒完成,就直接呼叫 invoker,否則就把 cache 的服務 (即 CacheOperationSource) 準備好,然後再去呼叫第二個 execute()。

第二個 execute() (git) 內容更長,所以這裡也是先篩掉一些內容,只先看最單純的部份:

private Object execute(final CacheOperationInvoker invoker, Method method, CacheOperationContexts contexts) {
  // Special handling of synchronized invocation
  if (contexts.isSynchronized()) {
    ...
  }

  ...

  // Check if we have a cached value matching the conditions
  Cache.ValueWrapper cacheHit = findCachedItem(contexts.get(CacheableOperation.class));

  ...

  Object cacheValue;
  Object returnValue;

  if (cacheHit != null && !hasCachePut(contexts)) {
    // If there are no put requests, just use the cache hit
    cacheValue = cacheHit.get();
    returnValue = wrapCacheValue(method, cacheValue);
  }
  else {
    // Invoke the method if we don't have a cache hit
    returnValue = invokeOperation(invoker);
    cacheValue = unwrapReturnValue(returnValue);
  }

  ...

  // Process any collected put requests, either from @CachePut or a @Cacheable miss
  for (CachePutRequest cachePutRequest : cachePutRequests) {
    cachePutRequest.apply(cacheValue);
  }

  ...

  return returnValue;
}

節錄下來的部份就是 Spring Cache 實際上操作 cache 服務和被 cache 的 method 的行為了。首先它透過 findCachedItem() 取得 cache 的結果,如果 cache hit 了,就把它放進 returnValue 中;反之,如果 cache miss 了,則會去執行被 cache 的 method 取得最新的執行結果,然後放進 returnValue 裡。

中間有一部分收集 put requests 的程式碼被我過濾掉了沒貼進來,不過大致上就是最後它會依據收集到要做的 put requests 開始一個一個 apply 到 cache 中,完成 cache 的更新。

​

2024年5月5日 星期日

Matryoshka Representation Learning (MRL) 與 Vespa

這幾天經由 Vespa 的文章,讀到 OpenAI 在今年(2024 年)二月份的一篇在解說 MRL (Matryoshka Representation Learning) 的文章,看起來真的相當有趣!不過我並不是這個領域的專業,所以細部的內容我也沒有完全理解,這篇筆記大體只是我自己在應用上的基本理解。如果內容有誤也歡迎留言提醒。😇

MRL 是什麼?

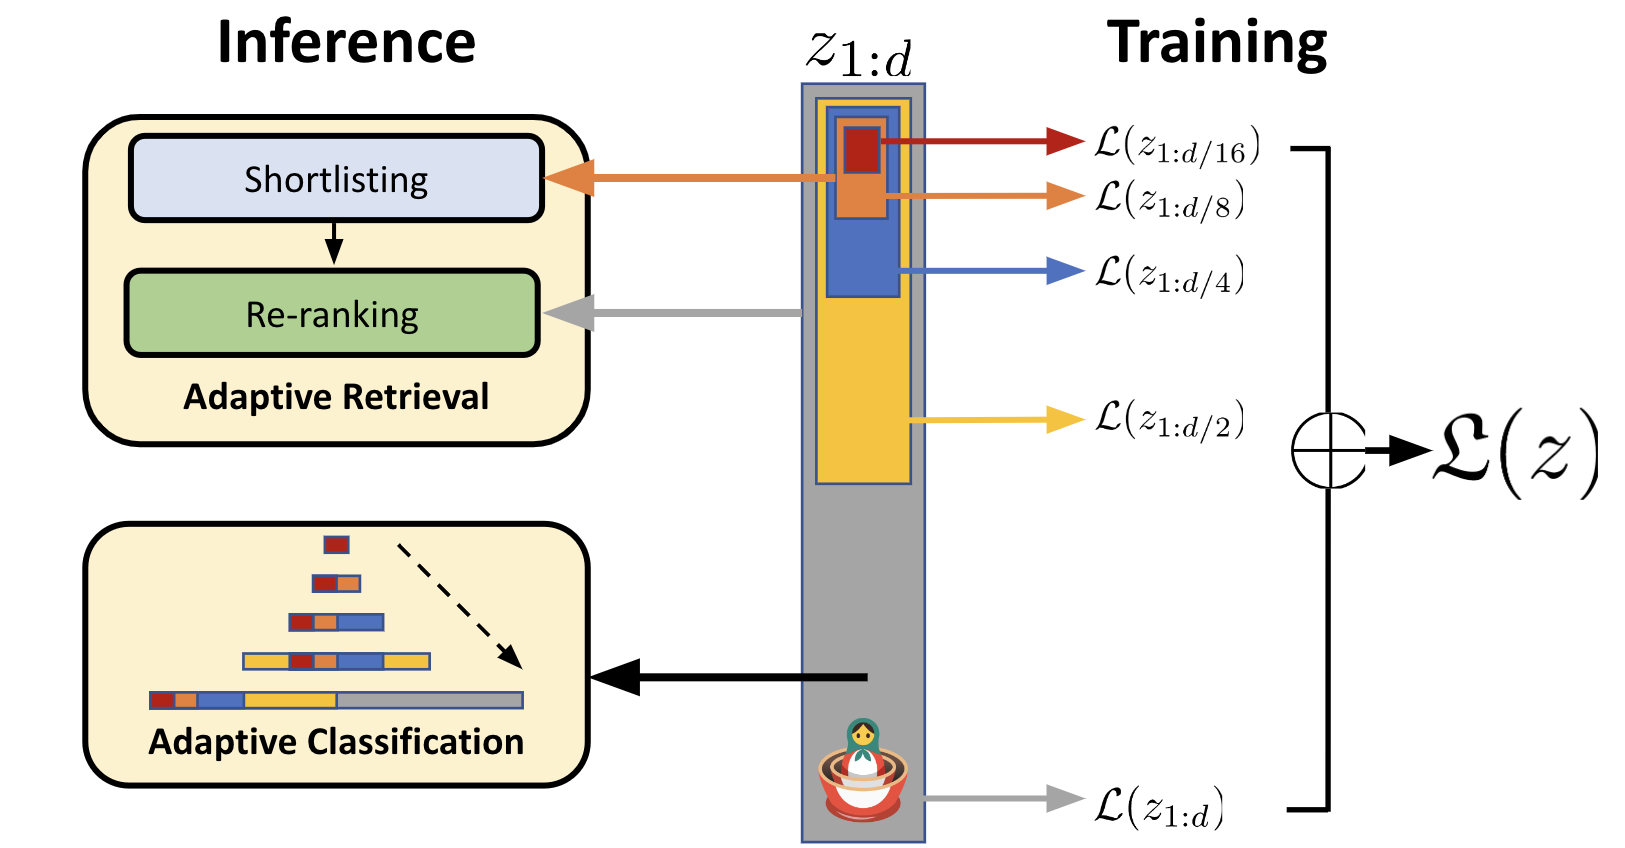
Matryoshka doll 就是俄羅斯娃娃,而 Matryoshka Representation Learning 就是一種利用類似俄羅斯娃娃的特性(小的娃娃可以被裝進大的娃娃裡)做出來的 Embedding 方法,或者說是東西的表達手法。

那麼 MRL 跟其他 Embedding 方法最大的差異是什麼呢?就我目前的理解,最大的差異就是上述提到的,它具有俄羅斯娃娃的特性。具體來說,就是小的 Embedding 可以被放在大的 Embedding 裡,或者說是大的 Embedding 切割掉尾巴後,就幾乎等於是小的 Embedding。這個特性最主要的優勢,是在於我們可以不用針對不同維度的 Embedding 分別儲存不同的 Embedding,而是可以統一存一個 Embedding,在需要高維的時候使用 Embedding 裡的比較多內容、需要低維(更快更低成本)的時候則使用 Embedding 裡的一部份內容即可。

俄羅斯娃娃

Vespa 與 MRL

那麼回到 Vespa 的使用情境,MRL 可以帶來什麼效果呢?首先如同 MRL 文章在上圖中提到的,MRL 會很適合用在 multi-phase ranking 的場合,例如先使用低維度來找出較符合結果的 candidates,然後第二階段時再針對這些 candidates 使用高維度來做更精準的計算,找出最佳的結果。

在 Vespa 二月份的文章中,首先提到他們做了一點基本的實驗,發現 MRL 產生的 Embedding 在使用相同模型的情況下,產生 8-dimension 跟 3072-dimension 的 Embedding,確實中間只差了 scale 而已,本質上非常相似。接著他們實際實驗了把 3072-dimension 的 Embedding,裁掉尾巴並只留下最前面的 8-dimension,然後去跟一開始就用 8-dimension 產生的 Embedding 做 cosine similarity 比較,發現兩者的相似度高達 99.99999999999996% 。

最後,Vespa 團隊用 COVID-19 的資料集做了實際的搜尋實驗,分別有以下幾種:

  • query_exact - 使用完整的 3072-dimension 並且不使用 ANN,也就是做最精準的語義搜尋。
  • query_256 - 改為使用 256-dimension 的低維度 Embedding,同樣也不使用 ANN。
  • query_256_ann - 使用 256-dimension 的低維度 Embedding,同時使用 ANN 做語義搜尋。
  • query_rerank - 使用 256-dimension 的 Embedding 作為 1st-phase,選出 top 100,然後用 3072-dimension 作為 2nd-phase
    結果如下:
run query_exact
.................................................. avg query time 2.7918 s
run query_256
.................................................. avg query time 0.3040 s
run query_256_ann
.................................................. avg query time 0.0252 s
run query_rerank
.................................................. avg query time 0.0310 s

query_exact     ndcg_cut_10: 0.7870
query_256     ndcg_cut_10: 0.7574
query_256_ann     ndcg_cut_10: 0.7552
query_rerank     ndcg_cut_10: 0.7886

先看效能的部份,從 3072-dimensions 改為使用 256-dimensions 可以大幅加快搜尋速度,query time 只有原本的大約 11% 而已。而使用 ANN 的話,跟最開始的 query_exact 比較,甚至是只用了不到 1% 的時間!但效能提昇了,搜尋結果變差了多少呢?從 NDCG 來看,差異從 0.787 下降到 0.755 ,其實差異並沒有非常顯著。

如果我們直接比較 query_exact 跟 query_rerank 的話,得到的結果是 query time 是原本的 1.1% ,而 NDCG 幾乎一樣!從數據來看,MRL 的潛力真的相當大 😍

​